How Good Can We Get With A Simple Model?
The first naïve model that was tried was very simple: in every game, the home team was predicted to win, with a likelihood of 1, by a score 5 points (the home advantage). This gave us a rough idea of how our elo scores predicted match results, but was almost entirely arbitrary. This gives a lot of room for improvement without making the model much more complex.
First, the home advantage of 5 was a guess, and selecting the average margin of victory may achieve a better RMSE. The average margin is about 1.01 points (where a positive margin means that the home team won by that margin). And second, setting the likelihood of victory for each home team to 1 may cause the Brier score to be higher than if we used a prediction like 0.75. The home team won about 48.6% of the matches, so a prediction closer to that should have a lower Brier score.
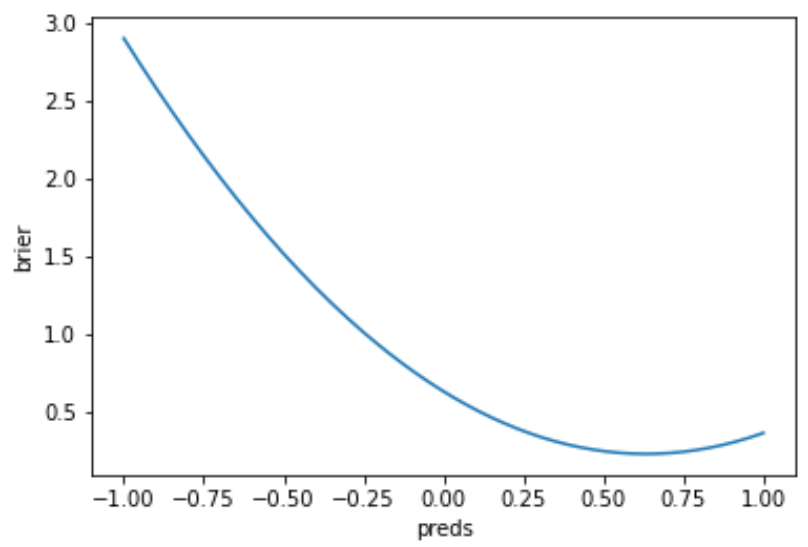
There is naturally some correlation between the spread and likelihood to win, but to avoid calculating that now our naïve model can have one best binary prediction that minimizes the Brier score and one independent best margin of victory that minimizes RMSE. A sweep of possible predictions and margins produce these plots:
Brier Score by Predictive Value
RMSE by Margin of Victory
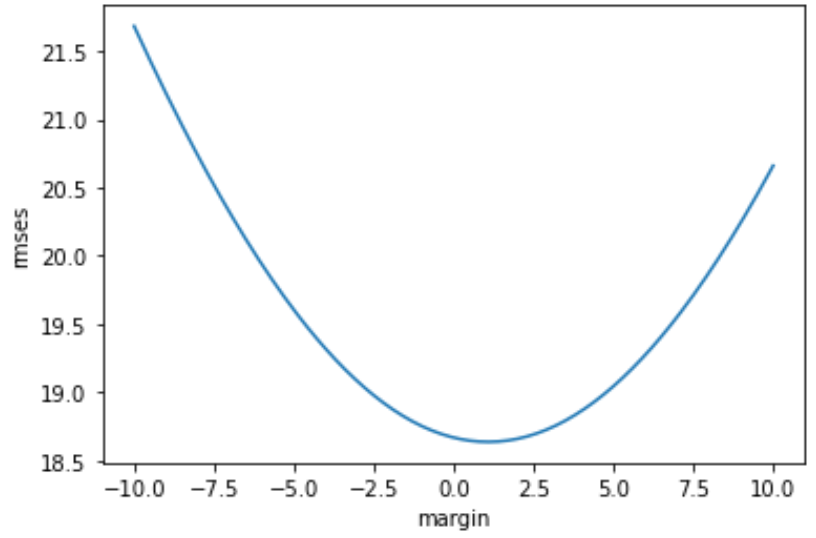
From these sweeps, our best prediction is 0.63 that gives a Brier score of 0.2322, and the best spread is 1.1 that gives a RMSE of 18.636.
| Model | Brier Score | RMSE |
|---|---|---|
| Original Naïve Model | 0.36677 | 19.04 |
| Best Naïve Models | 0.2322 | 18.636 |
| elo | 0.23052 | 11.68 |
Good news here, our basic elo model still performs better.